

STATUS AND TRENDS:
Mississippi River Valley Alluvial Aquifer in the Mississippi Delta, Spring 2022
Prepared by William Asquith, Coral Roig-Silva, and Erik Wojtylko from the Mississippi Alluvial Plain Project, Lower Mississippi-Gulf Water Science Center, United States Geological Survey (USGS)
Reproduced with permission from Mississippi Department of Environmental Quality (MDEQ) and Yazoo Mississippi Delta Joint Water Management District (YMD)
Click here for a pdf version of this webpage
Introduction
The USGS Mississippi Alluvial Plain project is developing tools to support groundwater management across the Delta including assessing recent and long-term trends in groundwater levels. This presentation handout summarizes both long-term groundwater level and precipitation data in the Delta from 1981 to 2022 and recent spring-to-spring changes in water surface elevations and related hydrologic variables.
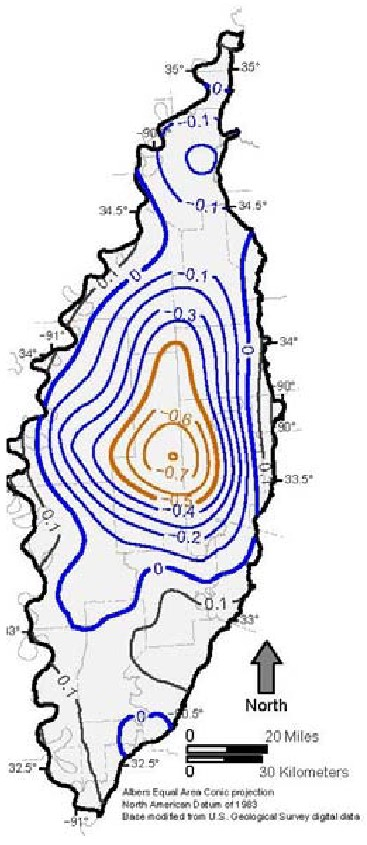
Long-Term Water Level Trends
This map shows contours of long-term water level trends in ft/yr across the Delta. The bold blue contour represents the spatial boundary between long-term positive/negative trends. All points within that contour, representing 65% of the Delta, have experienced an average decrease in water-level altitudes for the period 1981-2022. The bold orange contour represents the area experiencing average decreases in water level of greater than or equal to 0.5 ft/yr (defined as the composite hydrograph area). This contour encloses 10% of the Delta.
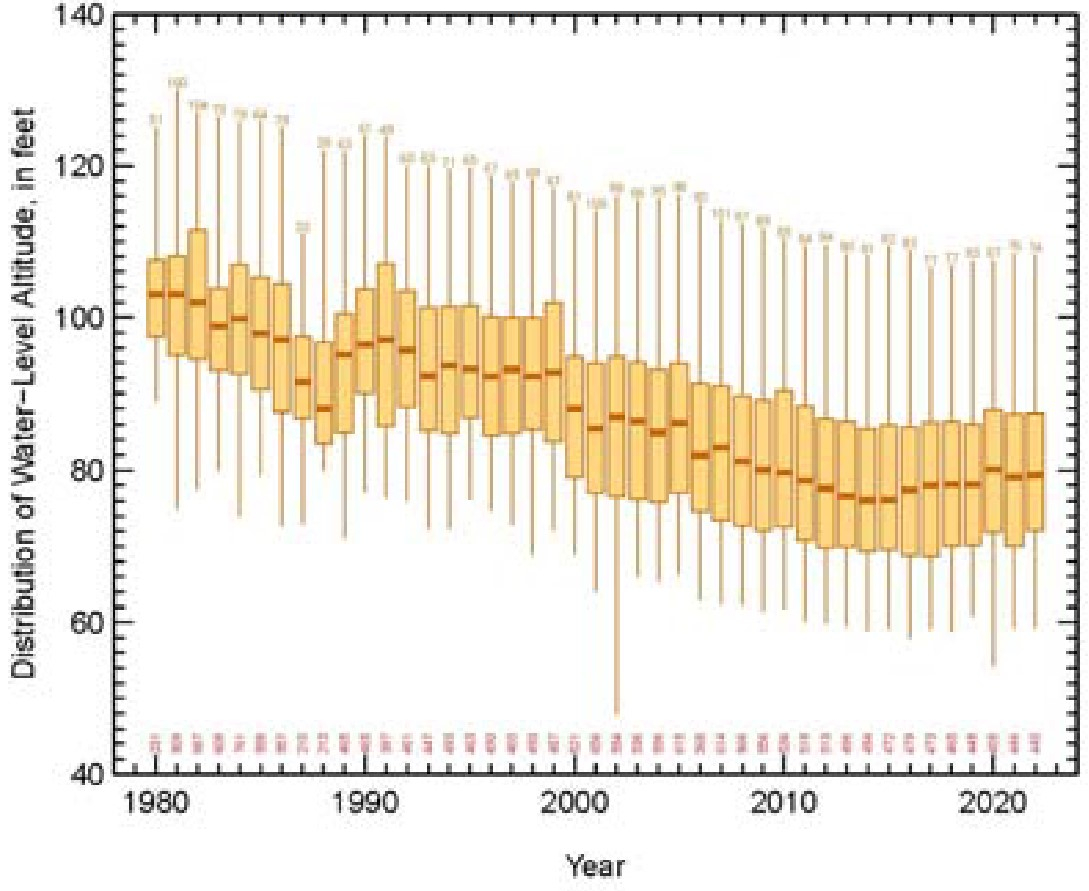
Composite Hydrograph Area
This hydrograph shows annual spring maximum water levels from all wells measured within the composite hydrograph region. Horizontal bar shows the mean of all wells for each year (1980-2022). Maximum, minimum, and mean values show long term decline. Stabilization in recent years coincides with multiple years of above-average growing season precipitation.
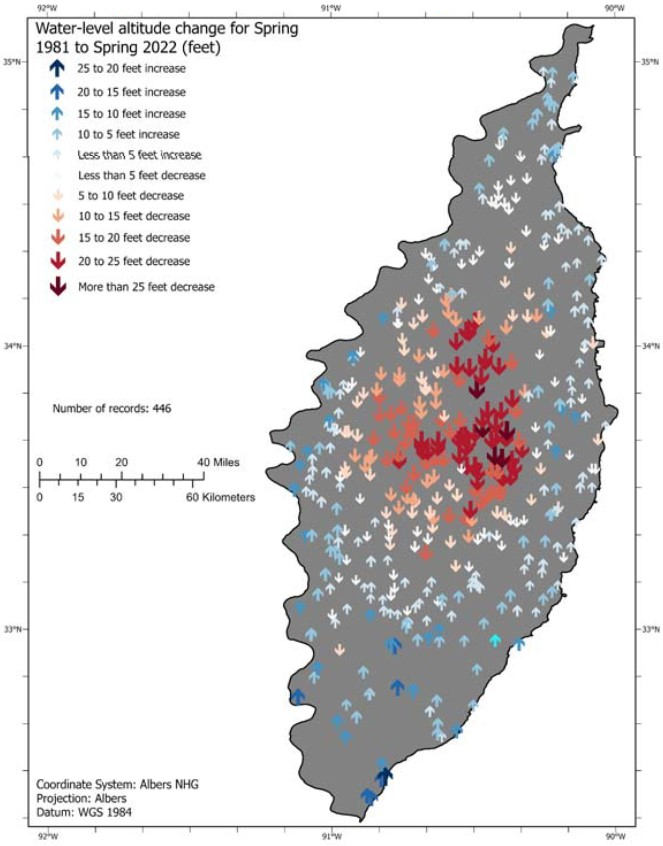
Long-Term Water Level Changes at Wells
This map shows the change in groundwater-level altitude in spring 2022 relative to the 1981 potentiometric surface and spring 1981 measurements.
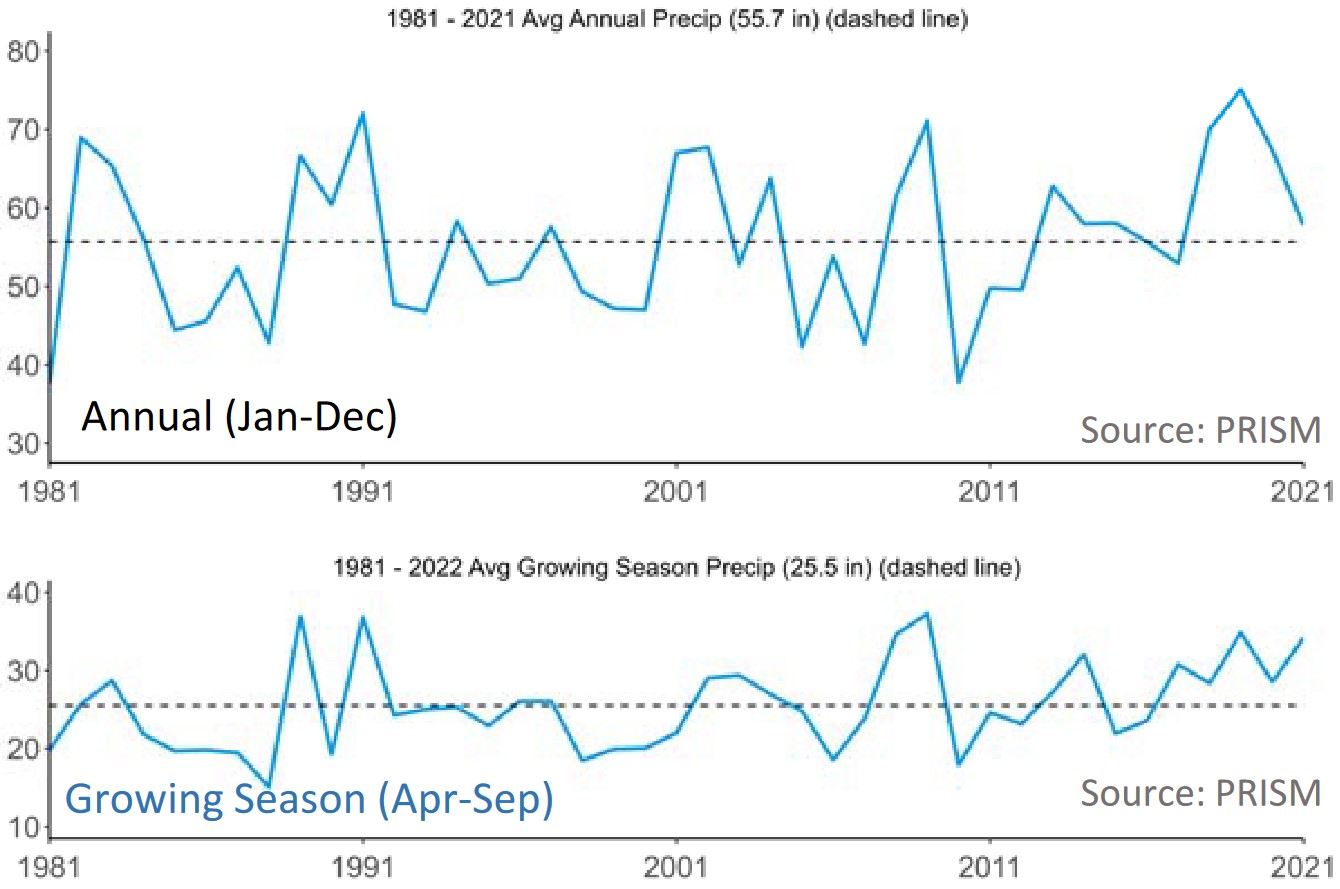
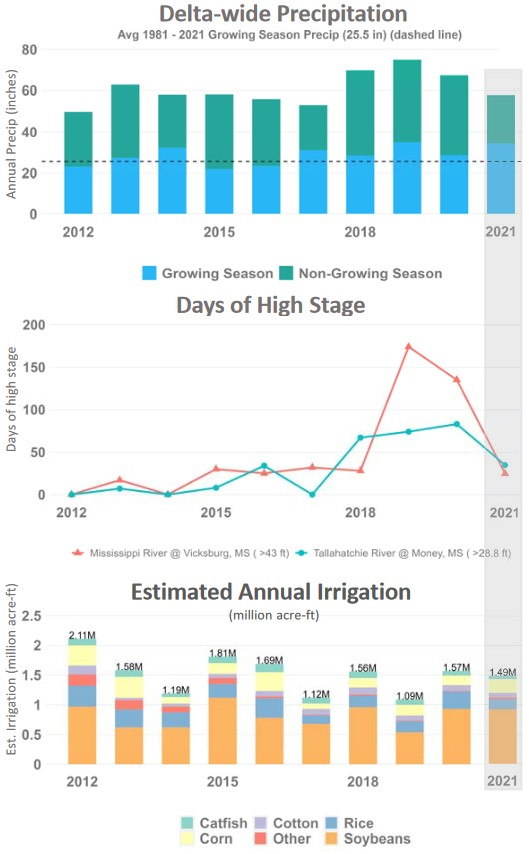
Delta-Wide Average Precipitation (inches)
Recent Water-Level Altitude Changes and Hydrologic Drivers
Recent Water-Level Altitude Changes and Hydrologic Drivers
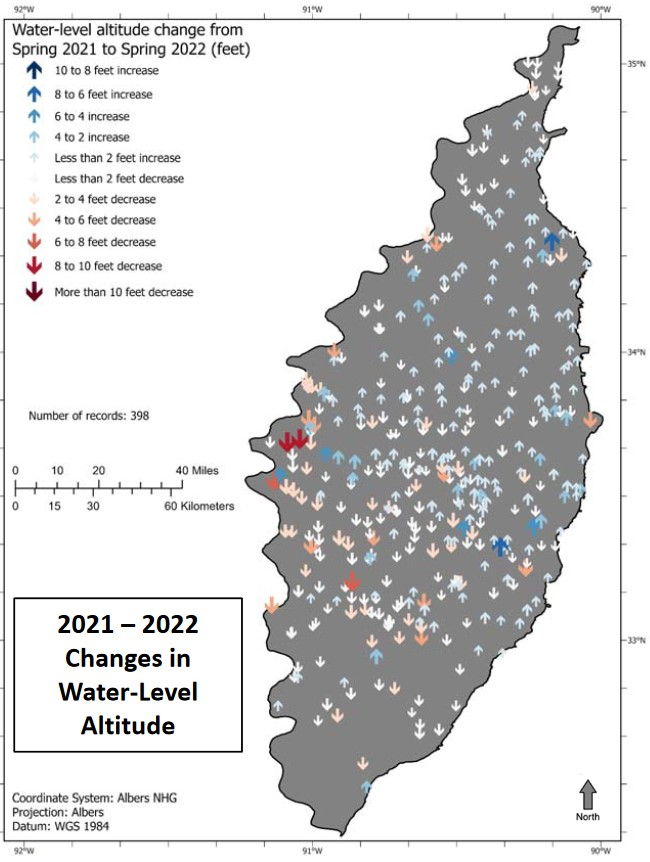
Annual water-level altitude changes (spring-to-spring) are shown below for 2021-2022. This map shows an arrow for each well that was measured in both years with the size and direction of the arrow indicating the degree and direction of water-level altitude changes at that observation point. Annual changes over much of the north and east Delta have been positive though some areas of the Delta have had a negative annual change.
Drivers
Aquifer levels are driven generally by water use and recharge. Estimated irrigation is shown here by crop as the primary water use. Water use is expected to correlate with growing season precipitation. Non-growing season precipitation and high river stages are expected to contribute to annual recharge.
Note
This information is preliminary and is subject to revision. It is being provided to meet the need for timely best science. The information is provided on the condition that neither the U.S. Geological Survey nor the U.S. Government may be held liable for any damages resulting from the authorized or unauthorized use of the information.
NCAAR Videos
Click playlist icon to view more videos.
Contact NCAAR
General Information
Kaye Sullivan
vfs23@msstate.edu
P:662.390.8510
F:662.390.8501
Showcase Demo
Drew Gholson, Coordinator
drew.gholson@msstate.edu
662.390.8505
Himmy Lo
himmy.lo@msstate.edu
662.686.3205